Measuring Policy Effectiveness of Cyber Defensibility and Deterrence


Published by The Lawfare Institute
in Cooperation With
![]()
Cybersecurity has not been measurable at a macro level 0372b175-857d-405a-bcd8-750258475415.png?sfvrsn=7ae0bb91_3) in part because decision-makers have not set a clear vision against which progress can be measured. This has now changed.
in part because decision-makers have not set a clear vision against which progress can be measured. This has now changed.
The White House’s National Cybersecurity Strategy calls for a more “defensible, resilient digital ecosystem” where “neither incidents nor errors cascade into catastrophic, systemic consequences.” The Defense Department’s cyber strategy relies heavily on cyber capabilities as part of its promotion of integrated deterrence. The department says it will “defend forward, disrupting and degrading malicious cyber actors’ capabilities and supporting ecosystems” to defend the nation and cause adversaries to “doubt the efficacy of their military capabilities as well as the belief that they can conduct unattributed coercive actions against the United States.”
These goals are often not directly measurable, but they can be assessed. Tracking success against such big-picture goals requires similarly large-scale, system-wide metrics. Unfortunately, too many existing metrics focus on the micro level, at the level of cybersecurity controls or individual enterprises. Tracking success is now particularly crucial as more cybersecurity is driven by mandatory—and often costly and competing—regulations for cybersecurity baselines.
Success requires four key steps: developing indicators that suggest whether defensibility (such as software that is secure by design) is improving or worsening, with targets where possible; sketching the baseline, the basic shape of the curves of those indicators over time, that is, whether they show improving or worsening conditions; proposing hypotheses of the expected behaviors if defenders’ interventions succeed; and tracking progress.
Developing Indicators and a Baseline
Imagine the poor central banker trying to understand if an economy were entering a recession, or the impact of interest-rate changes in response, without a time-series graph of gross domestic product (GDP)? To extend that example, decision-makers may care less whether the exact rate of inflation rose from 6 percent to 7.6 percent or 7.8 percent. The shape of the curve is clear: With inflation high and rising, they should push inflation-reducing policies.
Likewise for national-level cyber policy. Details matter, but overall defensibility and deterrence are tied to the macro trends in the three drivers of cyber risk over time: impact, threat, and vulnerability.
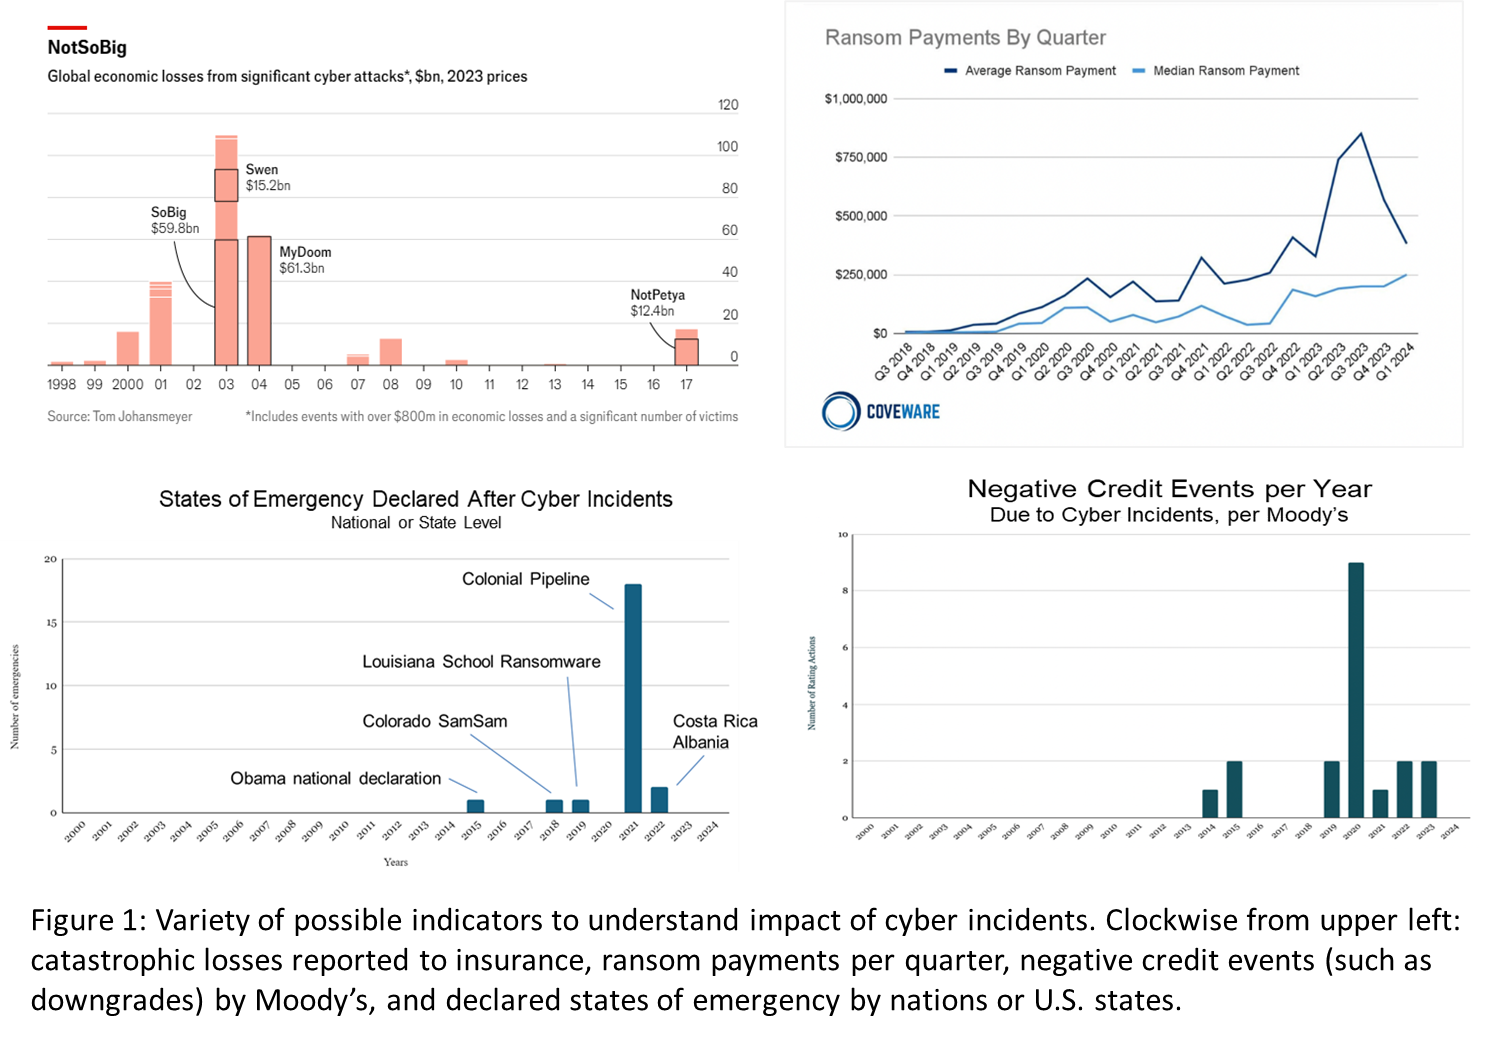
Indicators for impact include, among others, a reduction in the overall number of and harm inflicted by incidents, less damage from cyber incidents to systemically important entities, and a longer mean time between catastrophes. Relevant, quality data already exist, such as quarterly ransomware payments and insurance payouts for catastrophic cyber incidents. Our team at Columbia University is also tracking indicators such as cyber-induced declared states of emergency or negative credit actions for corporations. The graphics below give a sense of the shape of these work-in-progress charts.
Indicators for threat should track whether adversaries are working harder for fewer gains and struggling as costs are imposed on them, as called for in the Defense Department and White House strategies. Defenders should detect intrusions more quickly and force adversary groups to switch their tactics, techniques, and procedures from the easiest (logging in with stolen credentials) to the hardest (hacking using valuable zero-day vulnerabilities). These indicators have been observed and tracked for years, as discussed below.
Indicators for vulnerability give insight into areas such as resilience (for example, reducing single points of failure), the software development lifecycle (how software is architected, written, and updated), and attack-surface management (how end users, such as companies, install and patch software and hardware). For example, Veracode, a leading application-security company, tracks system-wide improvements in the software development lifecycle—such as the percentage of total applications that have a high-severity vulnerability and the percentage of open-source libraries with no known flaws when first scanned.
Defenders should, as they build confidence with these indicators, switch from just tracking progress to collectively setting targets. Scientists and activists have led the way here in a different context: With respect to climate change, one report sets out 42 actions needed to keep warming below 1.5 degrees Celsius. For cybersecurity, such goals might be, “By the year 2030, reduce global mean-time-to-detect to less than 24 hours” (from seven to 10 days today) or “at least 90 percent of vulnerabilities in open-source libraries should have an update available” (it is now at 73.8 percent, as reported by Veracode.)
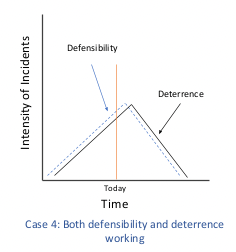
The basic shape of the baseline curves might be sketched, for example as in the graphic below, imagining curves for defensibility and deterrence graphed against intensity and time. Intensity, the left axis, is a function of frequency of incidents and their overall consequence. The details of how that would be calculated matter, but for now this broad illustration is useful to visualize the shape of the curves.
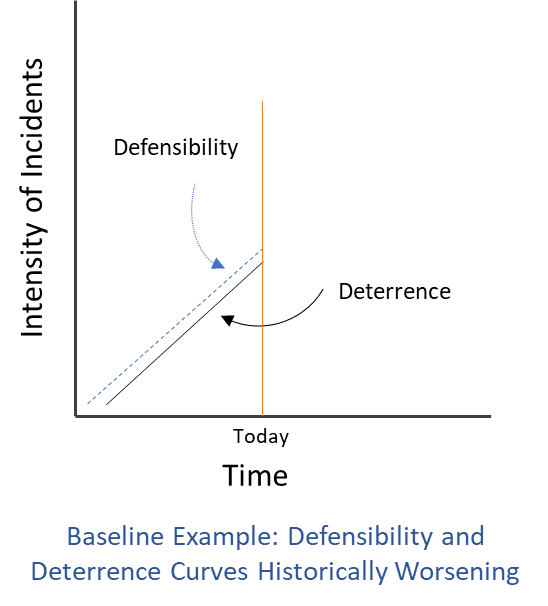
Better defensibility implies a more defense-friendly cyberspace. In a world where defensibility measures are implemented and working (a more defensible world), it would be more difficult for typical threat actors to succeed in their goals and relatively easy for defenders to succeed at theirs. Cyber incidents would still occur but generally without systemic impact. One example of a defensibility policy is that programmers—encouraged by the White House—are increasingly coding software in Rust and similar languages to substantially reduce memory vulnerabilities, one of the most prolific and ruinous kinds of bugs.
Defensibility assesses whether defensive measures are, over time, reducing the impact of cyberattacks from all threat actors. As defensibility improves, all other things held equal, intensity should decrease. The curve should trend downward, reflecting that improved defensive measures lead to decreased frequency and consequence of incidents.
Deterrence, by comparison, measures the impact of defensive measures only against the very small subset of incidents from the adversaries the United States wishes to deter—primarily Russia, China, North Korea, and Iran. As with defensibility, improvements to deterrence—whether from diplomacy or on-net operations to disrupt and frustrate adversary infrastructure and operations—should reduce intensity, trending the curve downward.
The success of defensibility and deterrence are related but likely not tightly correlated. Because nation-state adversaries are persistent and capable, improvements in defensibility are unlikely to have much impact on those states’ operations. Likewise, targeted deterrence against high-end cyber adversaries is unlikely to influence out-for-a-quick-buck cyber criminals.
Hypotheses About Interventions and Shape of Curves
These concepts and the theoretical relationships among them are simple. Defensive innovations should lead to decreases in intensity over time—and the most effective defensive innovations should yield the largest decreases. Yet, all too often, major cybersecurity policy goals are set without also proposing specific changes policymakers should seek to optimize for and ideally expect to see over time: Is it realistic to expect the curves to drop suddenly and massively, or is it more likely to be gradual? Will the curves not drop at all but merely not grow at the same pace? Will adversaries respond, so the curves will plateau in a few months?
As an illustration, here are four basic cases, built from the baseline example.
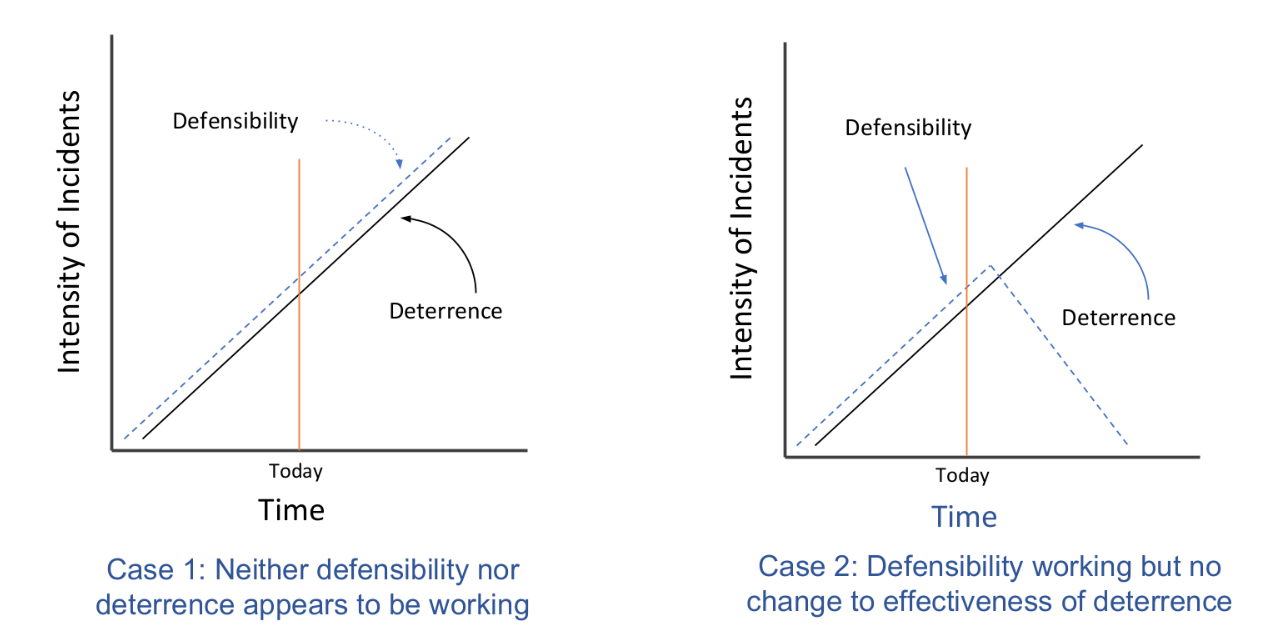
Case 1 illustrates the base case with the curves for both defensibility and deterrence heading up and to the right if the actions called for in the recent strategies are no more effective than all other past strategies. Despite defenders’ best efforts, intensity keeps worsening.
Case 2 displays the shape of the curves if there is an increase in defensibility that leads to a sharp decrease in intensity of general cybersecurity incidents. However, nation-state adversaries remain undeterred and able to continue their depredations despite efforts at deterrence.
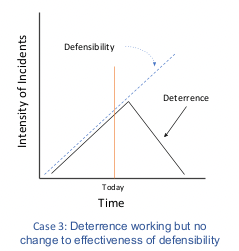
The reverse is true in Case 3, where efforts by the U.S. government to deter adversaries have succeeded but with no corresponding improvement in the effectiveness of defensibility measures. The effectiveness of deterrence measures may of course be correlated with other factors, such as a decline in global crises and conflict. These factors should be visible and measurable, allowing analysts to assess how much a decline in adversary activity might be due to U.S. deterrence measures.
Case 4 is the happy situation of major decreased angles in both curves, suggesting that the actions both the White House and the Defense Department strategies call for have been successful. Again, there will be a range of other plausible causes, but many of these can be identified and controlled for, but only if the trend is first established.
In cybersecurity, there are rarely such clear knees in the curve at scale. Policymakers should accordingly be clear if they believe their interventions will lead to a reverse-S curve (a sharp decrease that plateaus over time) or merely a decrease in the slope of the curve, as in Case 5.
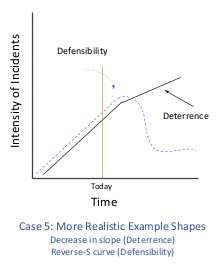
This suggests the impact of defending forward should have a very strong impact on the deterrence curve. Accordingly, anything less than a strong decrease (as in Cases 3 and 4) indicates it is not delivering the expected impact. But because the proponents of defending forward have not been clear about claims related to the shape of the curve (a steep drop of a reverse-S or just a decrease in slope), it is hard to assess if these operations are leading to the expected successes.
From Idealized Analysis to Policy Relevance
But can these predictive curves work in practice? Yes, but there are several hard problems to tackle. At Columbia University, we have a team researching whether “defense is winning” and have been making substantial progress toward a usable framework.
To start, data. Several commercial and academic data sets could be used to test these hypotheses, as likely could classified data sets held by the Defense Department and the intelligence community. The Cybersecurity and Infrastructure Security Agency will have substantially more comprehensive data, once they start receiving incident reports mandated by the recent Cyber Incident Reporting for Critical Infrastructure Act. Any kind of exact measurement of cyber incidents is impossible, as too many incidents go undetected; but to repeat, the particulars matter far less than the magnitude and direction of the curve.
Perhaps the best existing indicator sheds light on a classic battle: Attackers strive to improve their ability to evade defenders’ attempts to detect them. Attackers are losing.
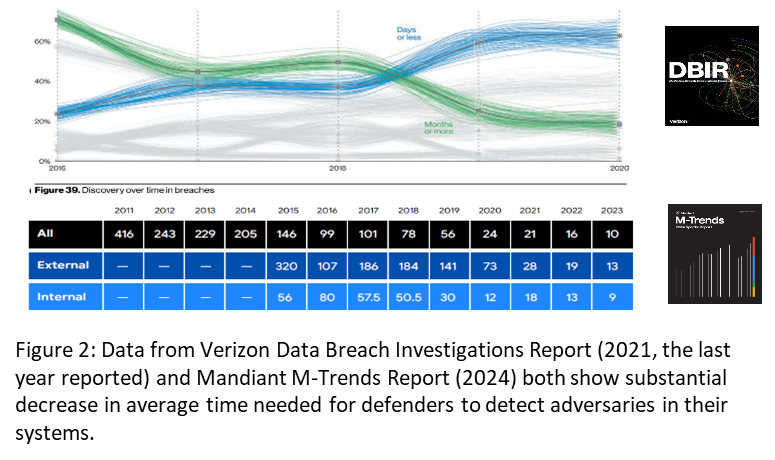
Information from Google Mandiant, SecureWorks, and the Verizon Data Breach Investigations Report all show a massive improvement in detection times. Defenders’ mean-time-to-detect and the related statistic of dwell time have both gone from being measured in months to days. This holds true even when controlling for the impact of ransomware (which needs to be detected, at some point, to begin the extortion). Shorter detection times have forced more threat actors to focus “on simpler and quicker to implement operations, rather than big, multi-site enterprise-wide encryption events that are significantly more complex.”
Defenders should not make too much of this good news. Despite improvements in some indicators on threat actors, not all might see such improvement. Also, in the face of failures of vulnerability, such as improperly secured customer credentials for cloud service providers, intensity might continue to worsen.
The deterrence curve will be harder to plot outside of government and select companies, as information on adversaries is held more closely. Moreover, because each adversary is different, each would likely need its own chart. However, such information does exist—sometimes in time-series format—within cyber-intelligence and response companies, major technology vendors, and of course within parts of the U.S. intelligence community and military. These organizations could presumably make deterrence graphs similar to those above.
Other indicators may be able to track threat actors just as well. For example, if defensive operations are working well, adversaries will need to frequently switch their tactics, techniques, and procedures. Old vulnerabilities will be ineffective, forcing them to find more vulnerabilities and use more (and more expensive) zero-day exploits. Because they are easier to observe, these adversary tactics, techniques, and procedures can be much more easily tracked than the frequency and severity of the impact of nation-state campaigns, usually designed to be clandestine.
It’s worth noting that these charts suggest only correlation—certainly not causation. But this is the case with any time-series, so responsible analysts must explore alternative hypotheses using other data and case studies.
Conclusion
Modern economics is unthinkable without indicators and time-series charts to guide targets, expectations, and decisions—such as whether to raise interest rates based on whether GDP or inflation are shrinking, growing, or remaining mostly stagnant. To extend the economics analogy one step further, cybersecurity is largely at the micro level, examining the security of individual systems or organizations, and not the equivalent of macroeconomics, focused on the dynamics of the systems as a whole.
Indicators and charts completely tracking these macro issues will not be easy to develop but must be created to determine if cyberspace is becoming more defensible and if adversaries are deterred from conducting cyber campaigns. Columbia University is working on an initial framework, an early version of which I recently presented at the Black Hat conference. In the medium term, Congress should create a Bureau of Cyber Statistics to better collect and analyze the needed data.
In the short term, the White House’s Office of the National Cyber Director should use such indicators of success to drive the annual, congressionally mandated posture reports.
The investment needed for these measurements may be several million dollars—but that would be substantially cheaper than building and employing cyber capabilities. It is an investment worth making.
.png?sfvrsn=4156d4f8_5)
-(1)-(1).png?sfvrsn=1bc11cd_4)